

The symptom
The owner looks at the bank statement and sees money. Looks at the report and sees a loss. Asks the accountant, and the answer comes in a language that satisfies the tax obligation but does not answer the question that was asked.
Or the reverse, which is worse: the report shows a profit every month, and still there is never any cash left.
In both cases the problem is almost never the system, the accountant or the arithmetic. It is the structure that classifies the entries — the chart of accounts. If that structure is wrong, everything downstream will be wrong to the cent.
Statutory chart of accounts ≠ management chart of accounts
Every company has a statutory chart of accounts, required by law and organised according to technical standards. It exists to satisfy the tax authority and to produce standardised statements.
That is not what this article is about.
The management chart of accounts exists to answer a different question: where is my money and what is it doing for me? It can be more detailed, closer to the vocabulary of the operation, and organised by the logic of whoever decides — not by the logic of whoever audits.
The two coexist. And the management one is what changes a company’s behaviour, because it is the only one anybody actually reads.
What a well-structured chart of accounts looks like
A good chart of accounts has three qualities: a clear hierarchy, groups that carry decision meaning, and stability over time.
A practical example of the structure:
REVENUE
  Operating revenue
  Non-operating revenue

EXPENSES
  Administrative expenses
    Water
    Electricity
    Rent
    Accounting
    IT

  Sales expenses
    Commissions
    Online marketing
    Offline marketing
    Promotional items

  Payroll
    Salaries
    Partner’s salary (pró-labore)
    Transport
    Meals
    Medical exams
    Year-end bonus (13th salary)
    Holiday pay

  Suppliers
    Inventory
    Freight

  Vehicle expenses
    Vehicle A
    Vehicle B
    Vehicle C

PROFIT DISTRIBUTION
  Distributions
    Partner A
    Partner B

EXTRAORDINARY EXPENSES
Notice three decisions in that structure.
Online and offline marketing are separate. This is not fussiness. It is the only way to answer, at the end of the quarter, which of the two brought in sales.
Each vehicle has its own account. A single lumped “vehicles” group hides exactly what you need to know.
The partner’s salary and profit distribution sit in different places. One is an expense, the other is not. Confusing them is the most common and the most expensive mistake. We will come back to it.
Mistake #1: the “General Expenses” account
Every company with a poor chart of accounts has an account like this. The name varies — “Miscellaneous”, “Other expenses”, “General” — but the function is always the same: to receive everything nobody knew where to classify.
It starts small. Two years later it is the largest line in the report.
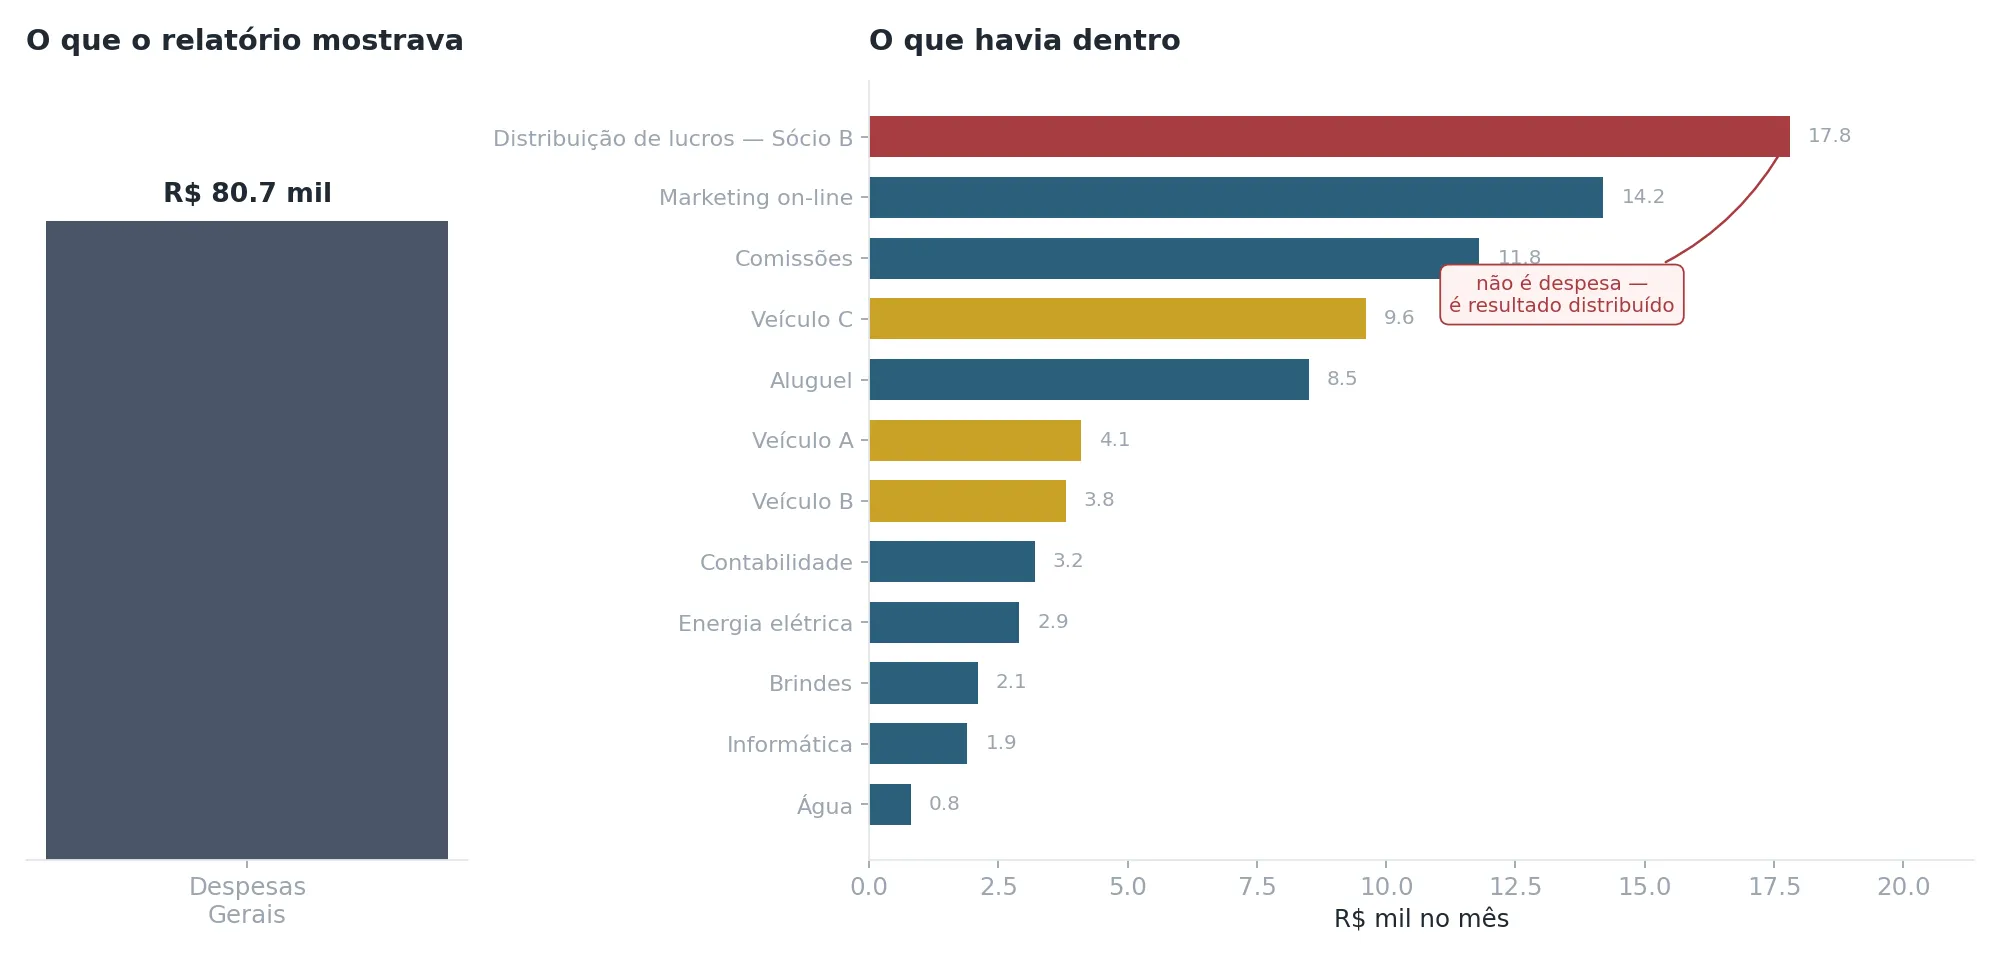
On the left, what the report showed: R$ 80.7k in “General Expenses”. On the right, what was inside it.
The report on the left is technically correct and managerially useless. It says the company spent money. It does not say on what, and therefore allows no decision at all.
Look at the item at the top. R$ 17.8k of profit distribution to a partner was classified as an expense. That is not an organisational detail — it is a distortion that makes the company look 22% less profitable than it is.
And here is a distinction many people run over, including inside accounting firms:
The managing partner’s salary is an expense. The partner who runs the company works in it — usually as its first and principal employee. Paying for that work is operating expense by nature, attracts social security charges, and is part of the real cost of keeping the business running. A company that does not record that salary as an expense is artificially inflating its own profit and, more seriously, hiding from itself what it costs to keep the operation standing. The day the partner has to step away and hire someone to do what they were doing, the bill shows up — and it comes as a surprise.
Profit distribution is not an expense. It is what is left after the company has paid everything, including that salary. It comes out below the result, not before it.
The practical rule is clean: the partner receives a fixed, predictable amount for the work performed — that is an expense, and belongs in payroll. Whatever they take beyond that is result — and belongs in distributions.
When the two are mixed in the same account, the company loses both pieces of information at once: it does not know what its own labour costs, and it does not know what it actually earned.
Mistake #2: lumping together what needs to be compared
The group “Vehicle expenses” looks sufficient. Three vehicles, one account, one number a month. Simple.
Now look at what that number hides.
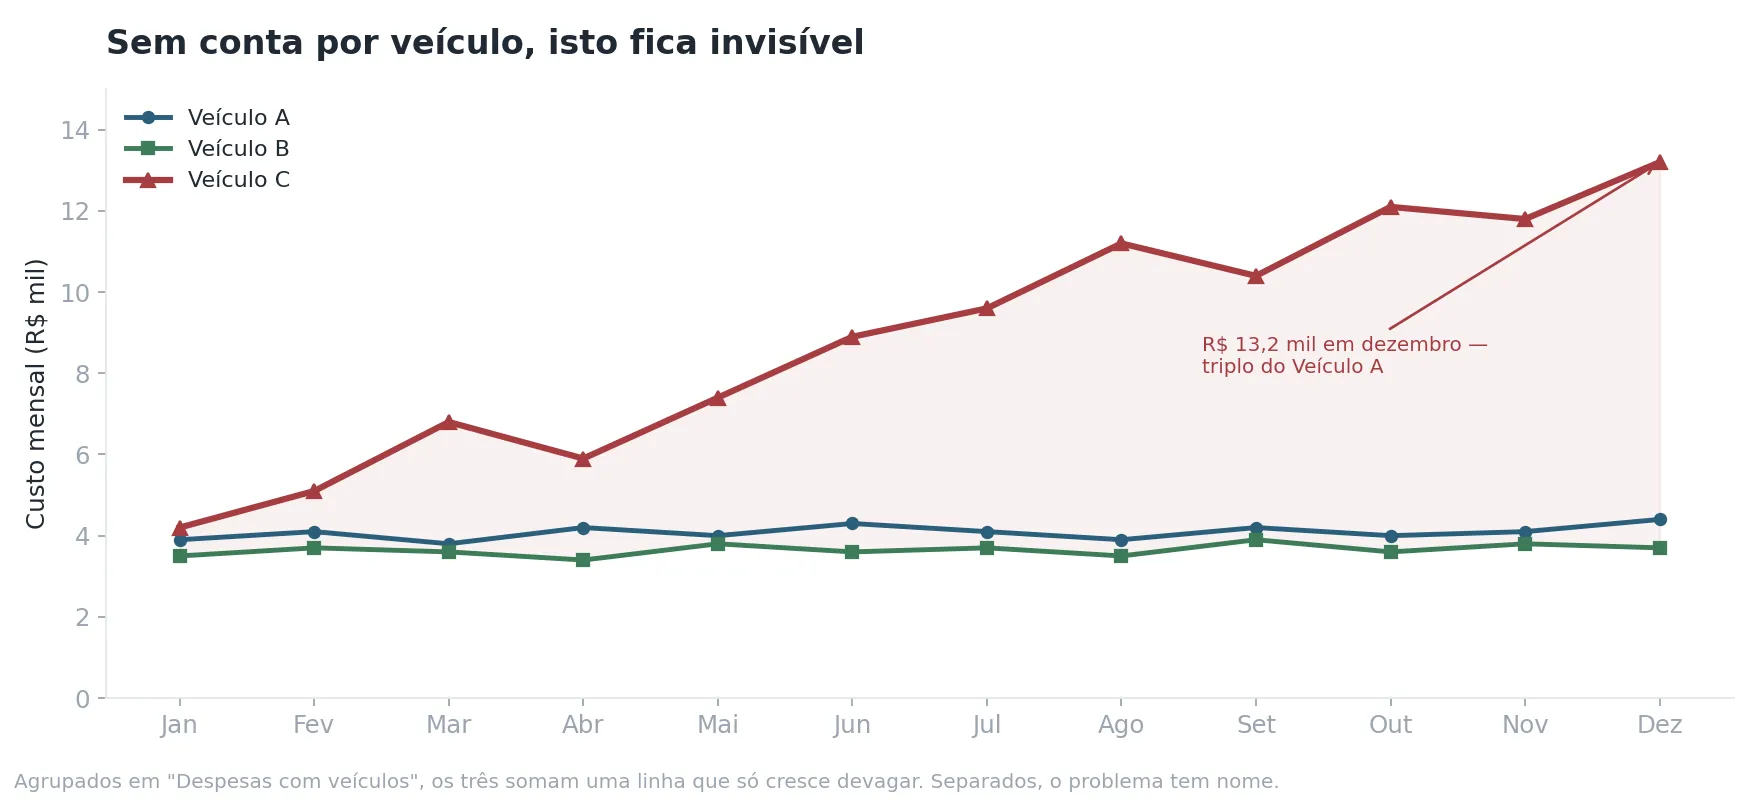
Added up in a single account, the three vehicles produce a line that rises slowly — the kind of thing attributed to “inflation” or “fuel went up” and never investigated.
Broken out, the problem has a name: Vehicle C went from R$ 4.2k in January to R$ 13.2k in December, while A and B stayed steady at around R$ 4k. That is not inflation. It is one specific vehicle that needs one specific decision — recurring corrective maintenance, abnormal consumption, or simply time to replace it.
The practical rule: create a separate account whenever the items are comparable with each other and the comparison could produce a decision. Three vehicles, four branches, two salespeople, five sales channels. If you can choose between them, you need to measure them separately.
Mistake #3: too much detail
The opposite extreme also hurts. A chart of accounts with 400 analytical accounts, where each type of office supply has its own line, produces reports nobody reads and entries the operator classifies at random — which corrupts the data at source.
Two questions before creating any new account:
- Does any company decision change because of that number in isolation?
- Does whoever posts the entry know, without hesitating, what goes into that account and what does not?
If the answer to either is no, the account should not exist.
Mistake #4: changing the structure halfway through
A chart of accounts only produces value when it allows comparison: this month against the previous one, this year against last.
Reorganising groups in July means losing comparability for the whole year. When the change is unavoidable — and sometimes it is — the right move is to reclassify the history retroactively, so the series stays intact. Systems that allow that reclassification in bulk save weeks of work.
The quietest mistake: year-end bonus and holiday pay
This one deserves its own section, because it distorts the month-by-month reading of results more than anything else — and because more people accept it as normal.
In Brazil, the year-end bonus (13th salary) and holiday pay are expenses that build up over the year and are paid in concentrated lumps. The employee earns 1/12 of the bonus for every month worked. The entitlement is created in January, February, March. The payment goes out in November and December.
If the system records the expense only when it is paid, this is the result:
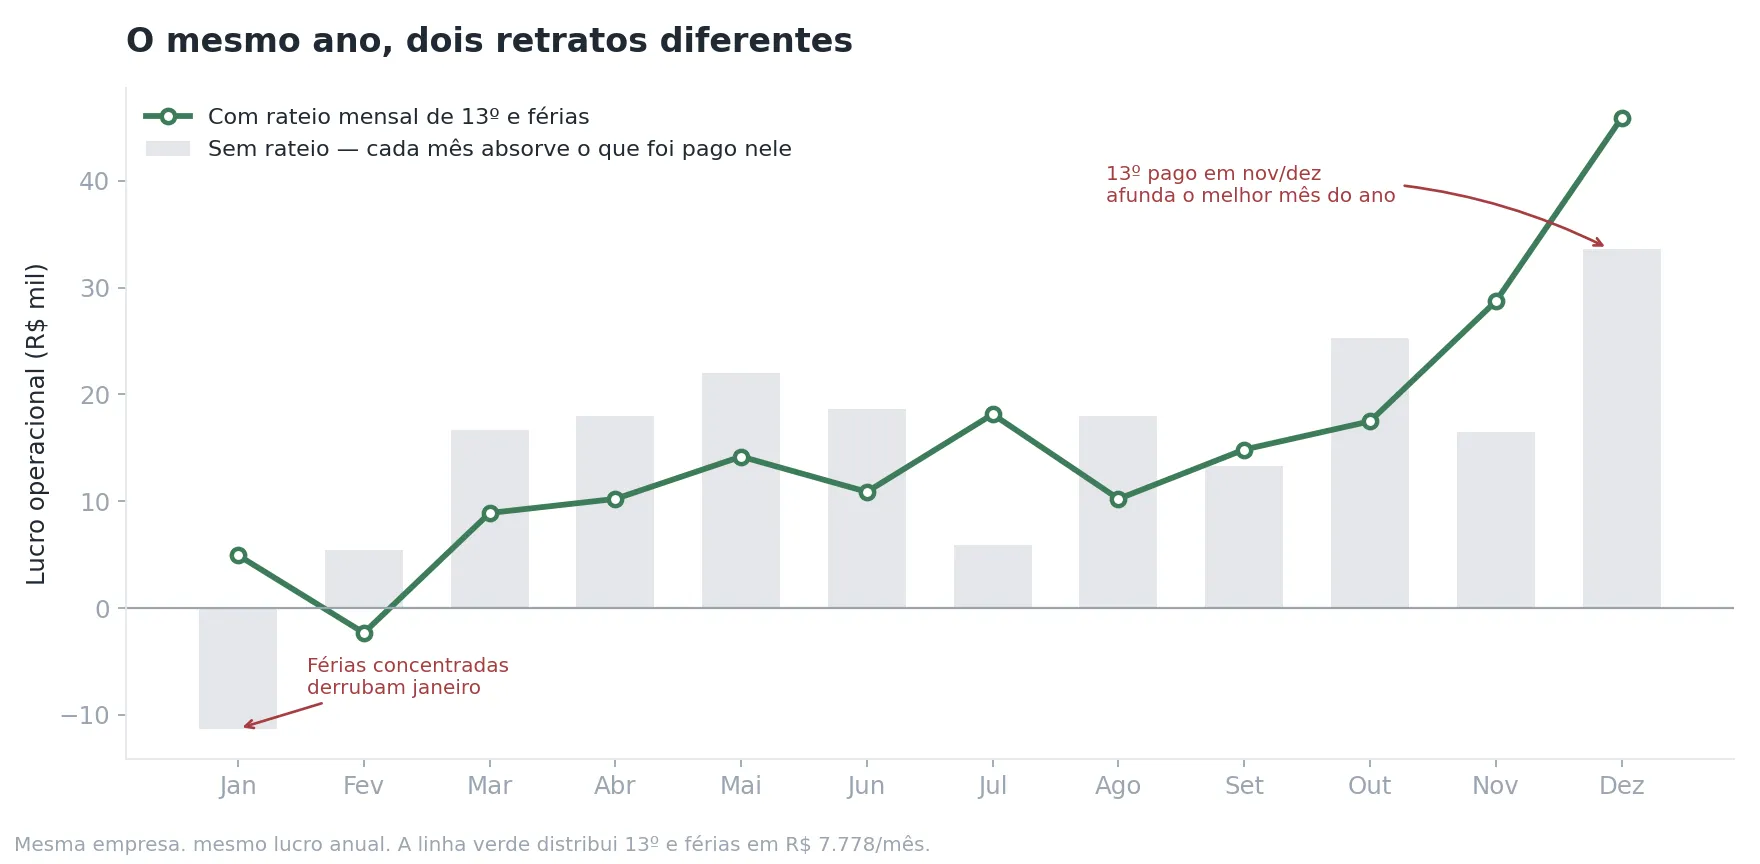
The grey bars show operating profit when each month absorbs only what was actually paid out in it. The green line shows the same year with the bonus and holiday pay accrued monthly.
What changes:
January closes with a R$ 11.3k loss in the reading without accrual, because much of the team’s holiday pay was disbursed there. With accrual, January closes positive at R$ 4.9k. January’s operation was never in the red — the month simply received the bill for an entitlement accumulated the year before.
December looks worse than it was. It is the best revenue month of the year, but it absorbs half the bonus. Without accrual it shows R$ 33.6k; the correct reading shows R$ 45.9k.
Both scenarios add up to exactly the same annual profit: R$ 182k. There is no accounting magic and no window dressing. What changes is when the expense appears — and that is precisely what determines whether you make the right decision in February or react to a false signal.
And there is a detail the correct reading reveals and the wrong one hides: February is the only genuinely negative month of the year, at R$ 2.3k in the red. Without accrual, February showed a R$ 5.5k profit and went unnoticed. Accrual does not only cancel false alarms — it reveals the real problems.
How to calculate it
The monthly provision is straightforward:
- Year-end bonus: 1/12 of the monthly payroll
- Holiday pay: 1/12 of the payroll plus the constitutional one-third, i.e. (payroll × 4/3) ÷ 12
In the example, with a payroll of R$ 40k:
| Provision | Calculation | Monthly amount |
|---|---|---|
| Year-end bonus | 40,000 ÷ 12 | R$ 3,333 |
| Holiday pay + 1/3 | (40,000 × 4/3) ÷ 12 | R$ 4,444 |
| Total | R$ 7,778 |
Each month absorbs R$ 7,778. When the actual payment happens, it draws down the accumulated provision instead of hitting that month’s result.
The same reasoning applies to any expense with irregular recurrence: vehicle tax and fleet insurance, professional body fees, annual software licences, foreseeable severance, the bonus on the partner’s salary. Every expense you know is coming should be spread across the period in which it is generated.
How this works in Expert Informática’s systems
Several of our systems let you configure automatic monthly provisions inside the chart of accounts itself. The user sets the amount or the percentage, the system posts the accrual month by month, draws it down against the provision when payment happens, and keeps Operating Profit consistent across the whole financial year.
We also work with multi-level hierarchical charts of accounts, comparative reports by period, and retroactive reclassification when the structure needs to evolve.
None of that replaces the initial decision — which is human, and yours: defining what your company needs to see. The system executes; the structure is yours.
Checklist: is your chart of accounts any good?
- No single account holds more than 15% of expenses without a breakdown
- There is no account called “Miscellaneous”, “General” or “Other” with material movement
- The partners’ salaries are recorded as payroll expense
- Profit distribution sits outside the operating expenses group
- Comparable items (vehicles, branches, channels, salespeople) have separate accounts
- Year-end bonus and holiday pay are accrued monthly
- Annual expenses (insurance, vehicle tax, licences) are spread across the year
- Whoever posts entries knows how to classify without asking
- The structure has been unchanged for at least twelve months
- You can answer “how much did Vehicle C cost this year?” in under a minute
If three or more items went unticked, your reports are telling a story that is not your company’s.
Conclusion
A chart of accounts is not accounting bureaucracy. It is the vocabulary a company uses to talk about itself.
A bad one does not exactly lie — it simply answers questions nobody asked while staying silent on the ones that matter. And because the totals add up, nobody suspects anything.
The good news is that fixing it requires neither a new system nor a consultancy. It requires sitting down for an afternoon, looking at the list of accounts, and asking of each one: what does this account let me decide?
The ones without an answer are surplus. The decisions you cannot make are what is missing.